
The Global Childhood Cancer Puzzle - Edge 1.3
This is part three of a three part essay about the global burden of childhood cancer. If you haven’t read from the beginning, you may want to start from part 1 or check out part 2 if you missed that.
Measuring the health consequences of cancer
Let’s think for a minute what the measures that we’ve discussed are telling us. Incident cases tells us about the number of new cases that occur in the world and survival tells us the final outcome for someone who has the disease. These measures tell us about the beginning and the end of the cancer journey, but there are many things that happen between those two points that are worth measuring, particularly the suffering and loss of wellbeing that result from cancer. Now you may be wondering, “how in the world do we measure loss of wellbeing? Loss compared to what?” The answer is that researchers measure it against the expected level of health for a patient if they never developed cancer.
Let me provide an example to clarify these concepts. Suppose there is a restaurant with 100 people eating in it. Suppose most people have a lovely time drinking and chatting with friends; however, ten unlucky people order the chicken special that was undercooked by the chef and immediately get terrible food poisoning. If we were interested in quantifying the burden of food poisoning in our 100 patrons, we could say the number of incident cases was 10 per evening at the restaurant. Also suppose, tragically, 2 people out of the 10 cases die from their food poisoning but the rest survive and completely recover. Both die within the first month, so that seems like a good timeframe for reference. We can say that 1-month survival of this terrible food poisoning is 8 in 10 or 80%. These numbers give us a good snapshot of the situation, but there is still something missing.
If you’ve ever had food poisoning, then you know that there is much more to the experience than these number describe. The illness can bring terrible stomach pains, vomiting, and other messy symptoms. The suffering from it can be intense and may last a few hours to weeks. Suppose you were one of the people who got food poisoning at this restaurant and then recovered. If someone described the impact of the disease as, “10 people got sick that night and 2 died”, you would think this does not describe the experience well for you or anyone else who got sick. To better capture the experience of the illness, the suffering it causes seems like an important part to describe.
To measure this experience, researchers have developed a tool called the “Disability-Adjusted Life Year”, or DALY for short. DALYs quantify suffering along two dimensions, the loss of wellbeing for patients living with a disease and the years of life lost for patients who die from it. Let’s take these one at a time.
To measure loss of wellbeing (technical term: the years lived with disability), researchers have to first decide what is normal wellbeing. They can make the assumption that, roughly speaking, people who never develop the disease and have similar health to the patient before the patient is diagnosed can act as a good point of reference for the health the patient would have experienced if the patient never developed the disease in the first place. Then they measure the actual health of the patient with the disease against the healthy people. There are many conditional assumptions in this concept, which makes it confusing. We can simplify it to say that researchers measure the difference in health between people without the disease and a person with the disease. How do you put a number on the health state of a person with a disease? The most common way researchers do this is they ask a bunch of people to rate different states of health relative to full health and then they decide on an average “value” of the diseased health state relative to healthy state. Then researchers subtract the “value” of the health state of a person with the disease from the “value” of full health over time to calculate an estimate of lost wellbeing.
Measuring years of life lost is more straightforward. Researchers can say that the life expectancy (average lifespan) for a bunch of people similar to the patient but who do not have the disease is the life expectancy of the patient of the patient if they never developed the disease. Researchers then take the life expectancy and subtract the age at which a patient dies, and they have an estimate of the years of life that were lost due to the disease.
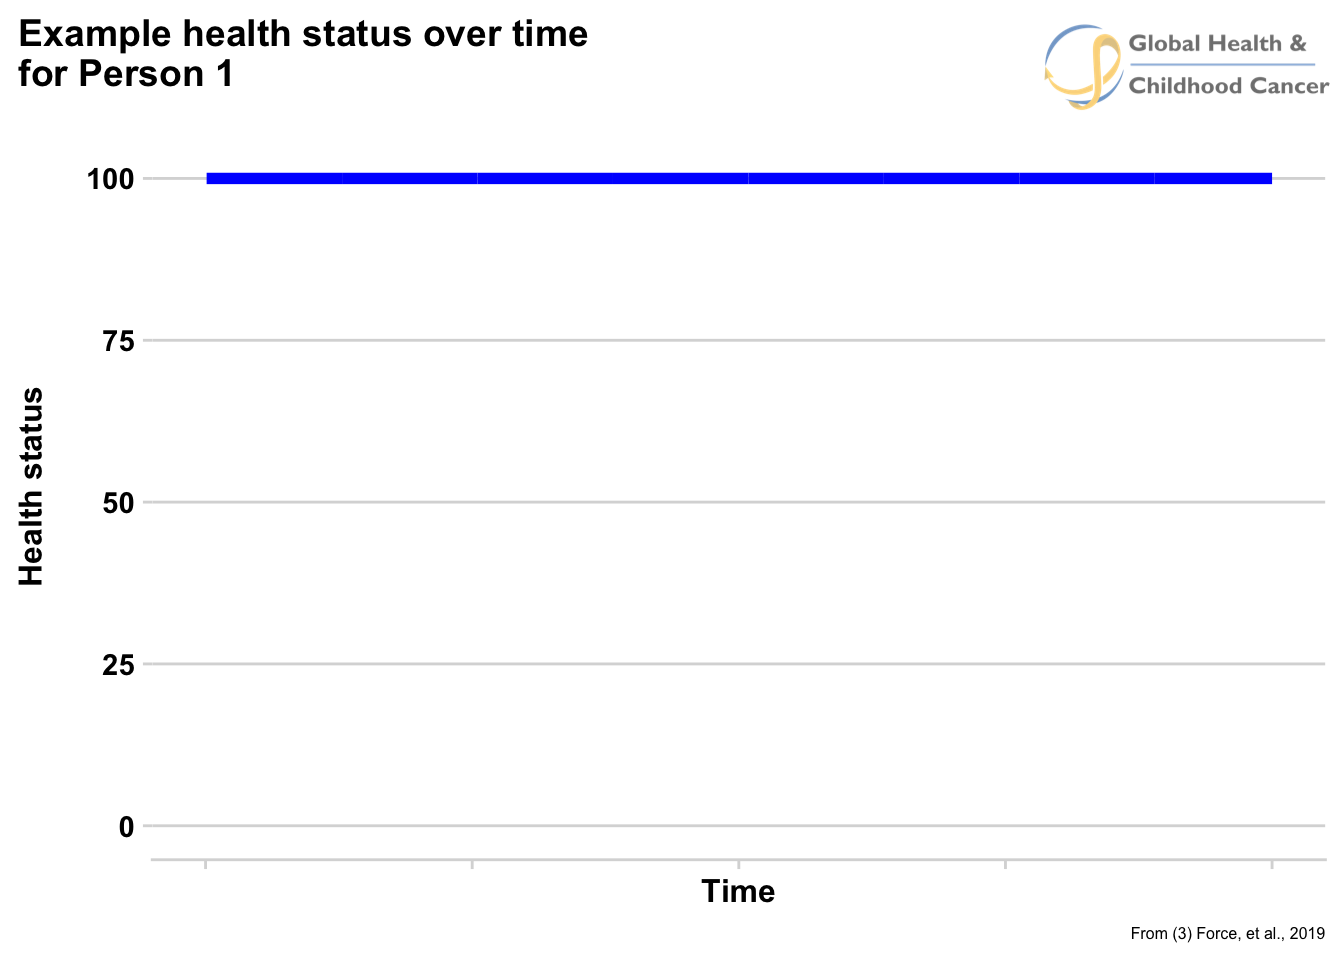
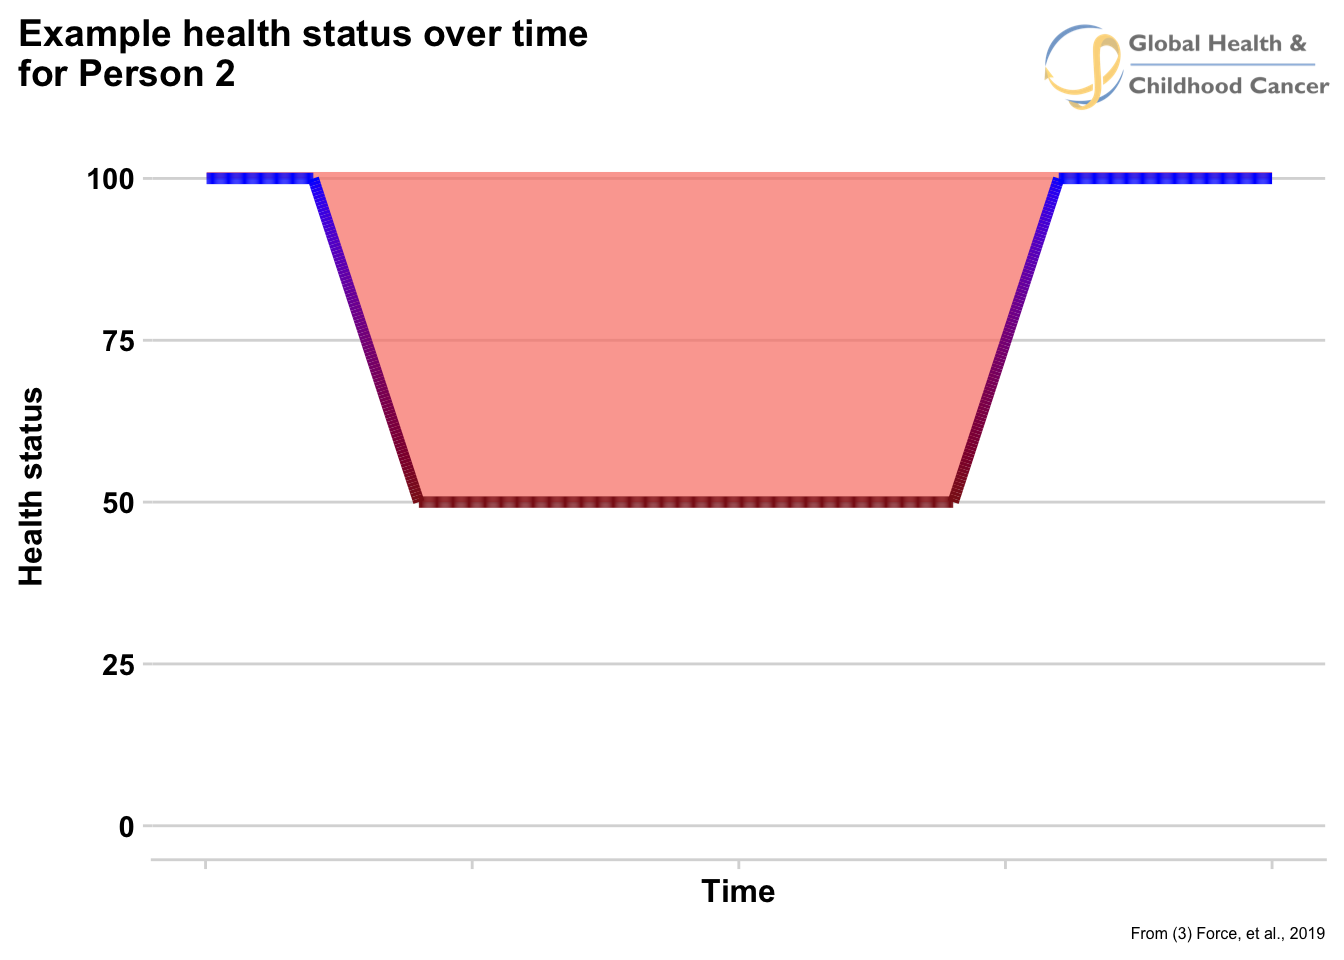
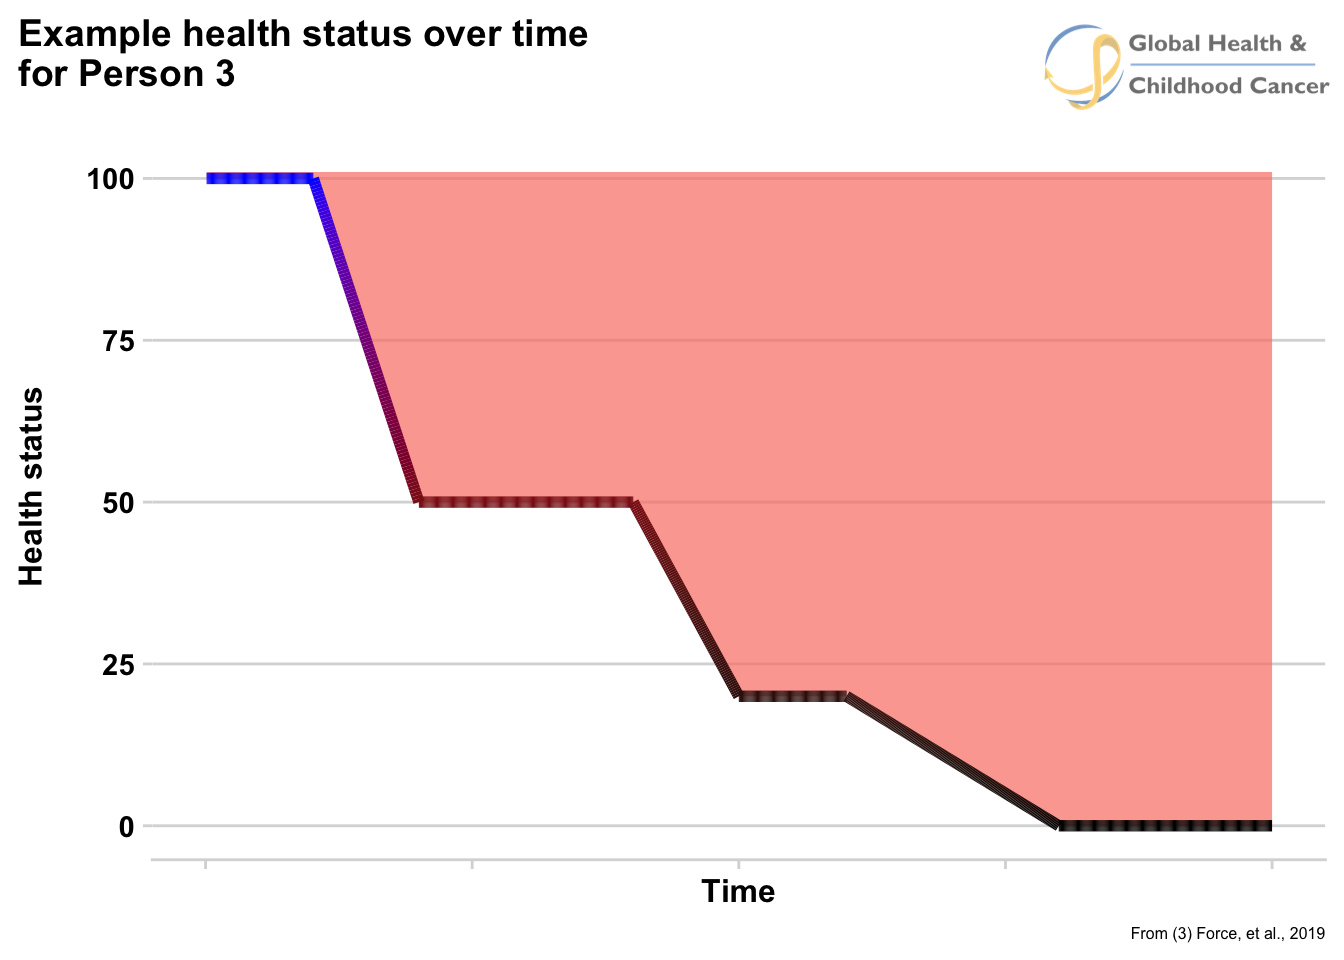
Figure 6 shows an example of the health states for three different types of people in our example. The top line is a healthy person who never develops food poisoning, the middle line is a perspon who develops food poisoning and then recovers, and the bottom line is a person who develops food poisoning and eventually dies. The difference in area between the top line and each of the other two lines are the loss of wellbeing for those patients (pink colored areas on second row of figure 6). The difference between the life expectancy (blue line on the graph) and the age at which the bottom line reaches a health state of zero is the years of life lost.
Fig. 6
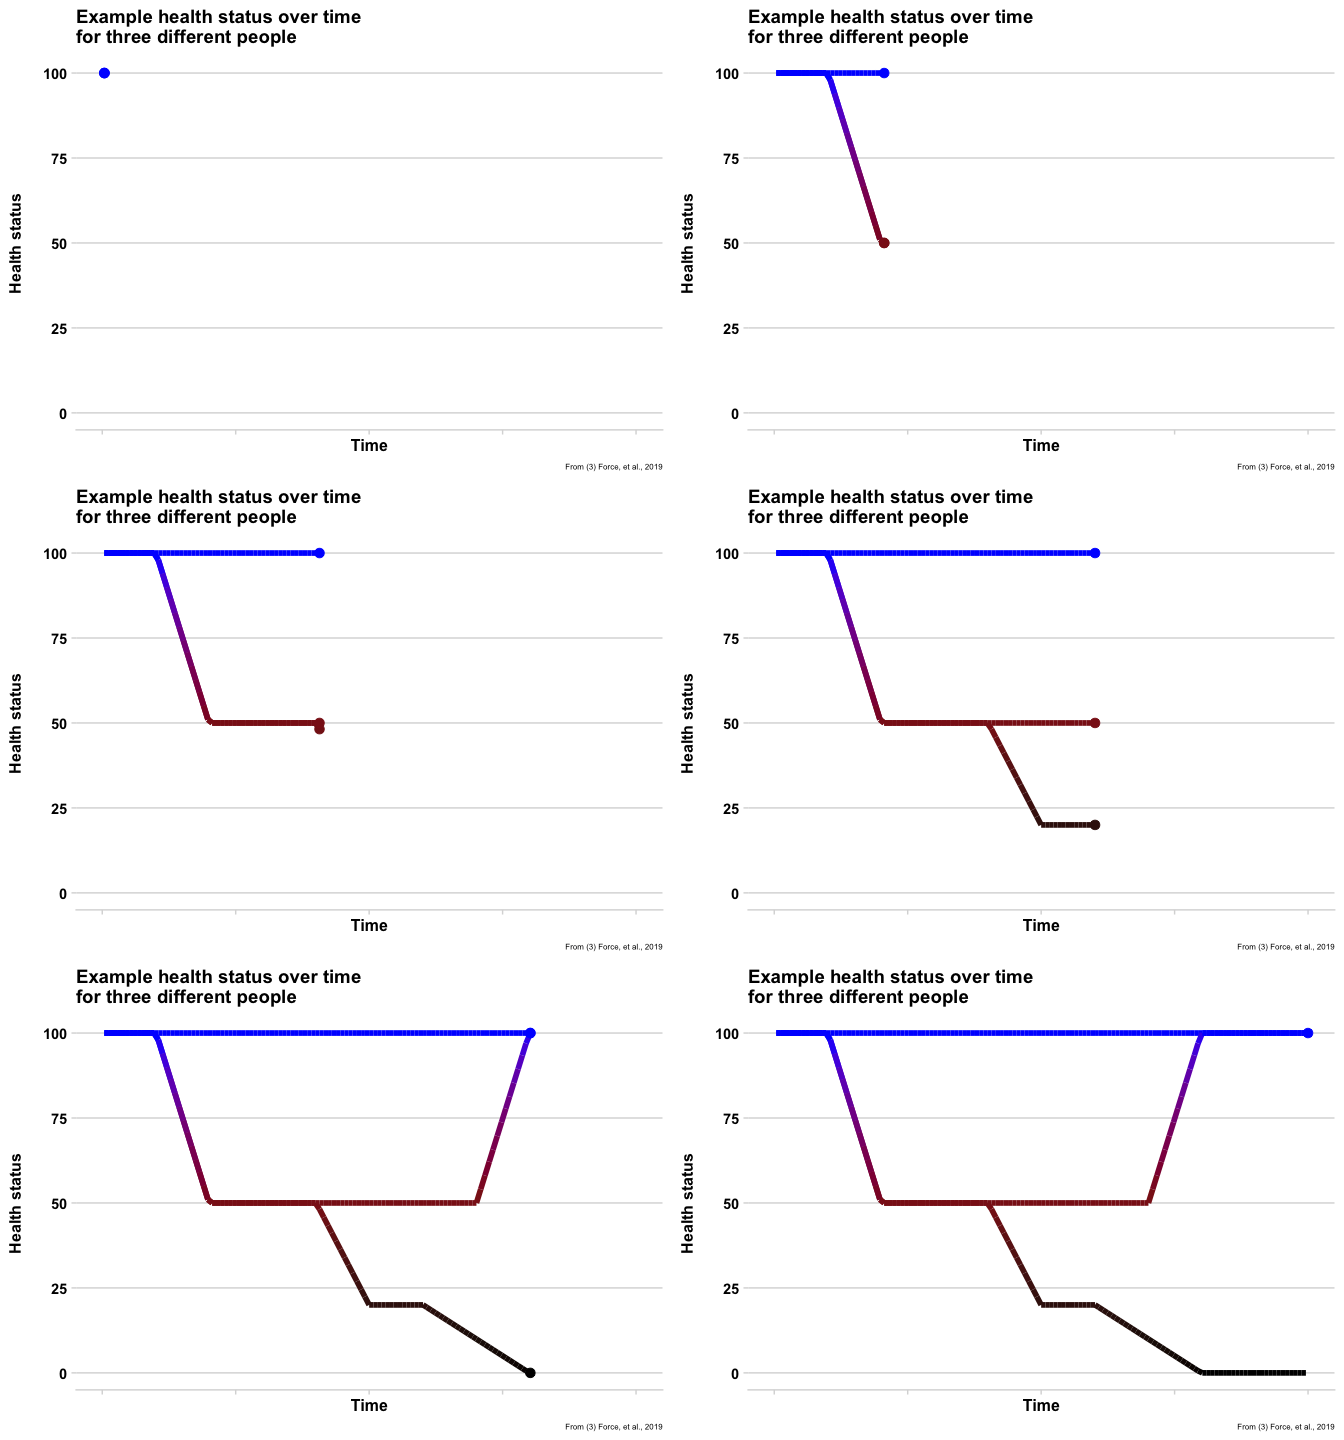
Now that we know how to measure DALYs, the next question is, “what are they used for?” DALYs allow for two important comparisons. The first is that they allow researchers to measure the consequences of a disease relative to where it occurs in a lifespan. The years of life lost for a person who is 100 years old and develops cancer compared to a person who is 5 years old are very different and DALYs give researchers a way to put a number on that difference. The second thing DALYs allow is the comparison of very different diseases. With them, we can think about questions such as, “how do the health consequences of a common cold compare to cancer”. Colds are very, very common, somewhat uncomfortable, and most of the time get better on their own. Cancer is the exact opposite. If we wanted to, we could calculate DALYs for each, which could allow us to compare the health consequences and burden of these two very difference diseases.
It is important to point out that DALYs are very rough estimates of the experience of having a disease. They give researchers a way to put a number to this experience, so they can track it over time and compare it across other diseases. What DALYs are not is an actual statement about what living with cancer or any other disease is really like. We could write a 10,000-page novel try to convey the true experience of just one child with cancer, and still not capture the truth. The experience of cancer is a profound trial to endure and no researcher wants to cheapen that. DALYs are imperfect tools used by limited humans to try to measure an experience that defies description for the sake of helping those experiencing it. Furthermore, there are well known critiques of DALYs and what they do and do not measure that are worth exploring to better both what specifically they are measuring and what are their limits.
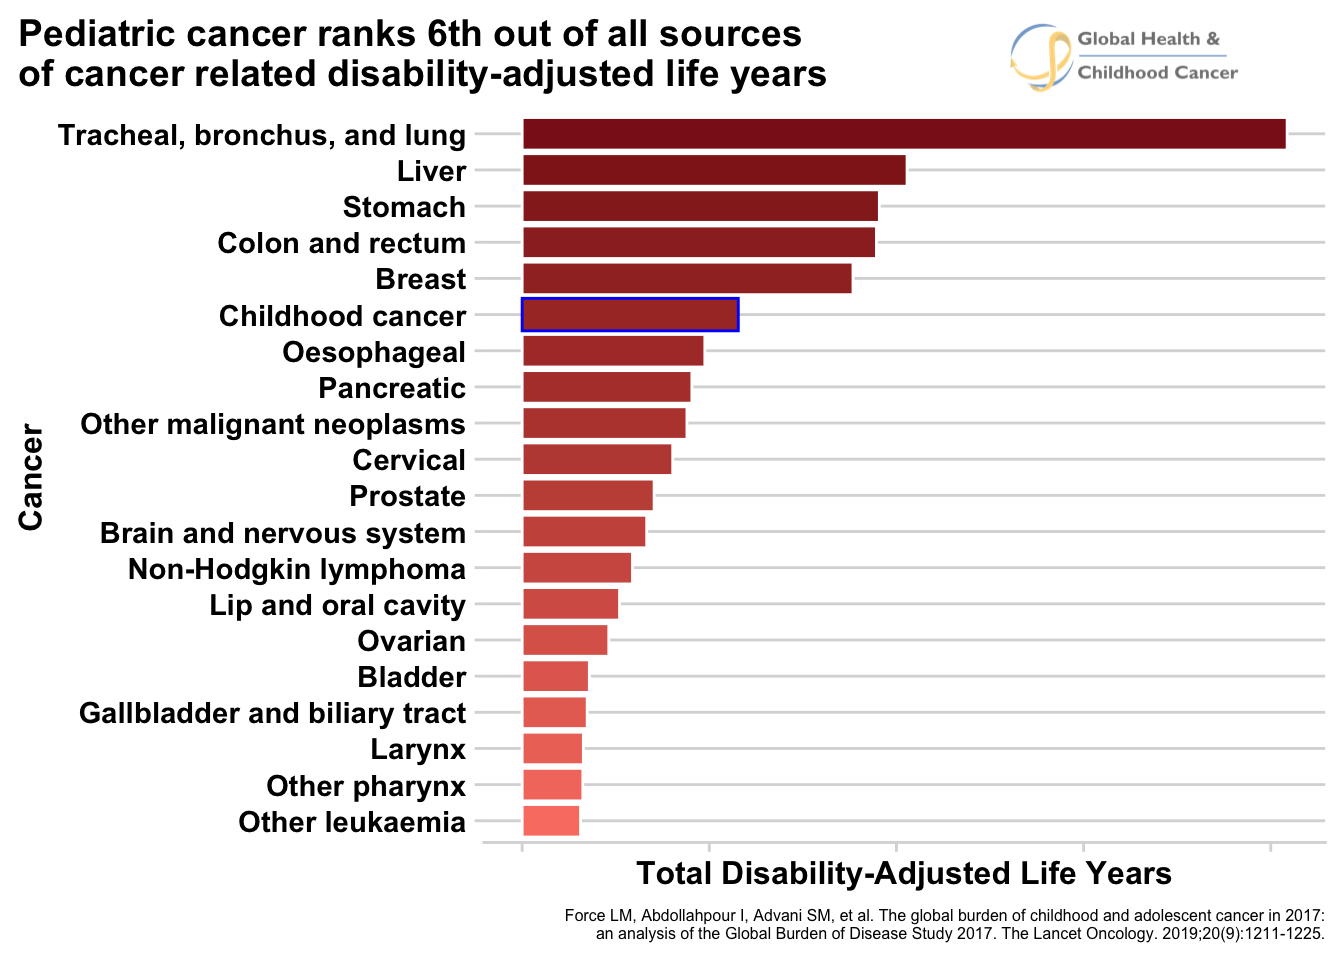
Let us now turn to measuring the burden childhood cancer using DALYs. A group of researchers recently published the most comprehensive estimate of DALYs due to childhood cancer to date.\(^3\) The most important finding from this paper corrects a common wrong belief that goes “because childhood cancer is rare, its total burden is low compared to other diseases.” The researchers reported that childhood cancer caused 11.5 million DALYs in 2017. While this single number may be difficult to interpret, compared to the other most common childhood diseases, childhood cancer ranked 9th globally. In upper-middle income countries, it was the 3rd largest cause of DALYs, falling only behind congenital birth defects and lower respiratory infections. See figure 7 to see the comparisons. They also compared DALYs to adult cancers and found that, globally, childhood cancer ranks 6th among all types of cancers (see figure 8) and in low and low-middle income countries, it is ranked 1st! Although childhood cancer is less common compared to other disease, the researchers demonstrated it is still responsible for a large amount of disease burden in the world.
Fig. 7 - DALYs due to pediatric diseases
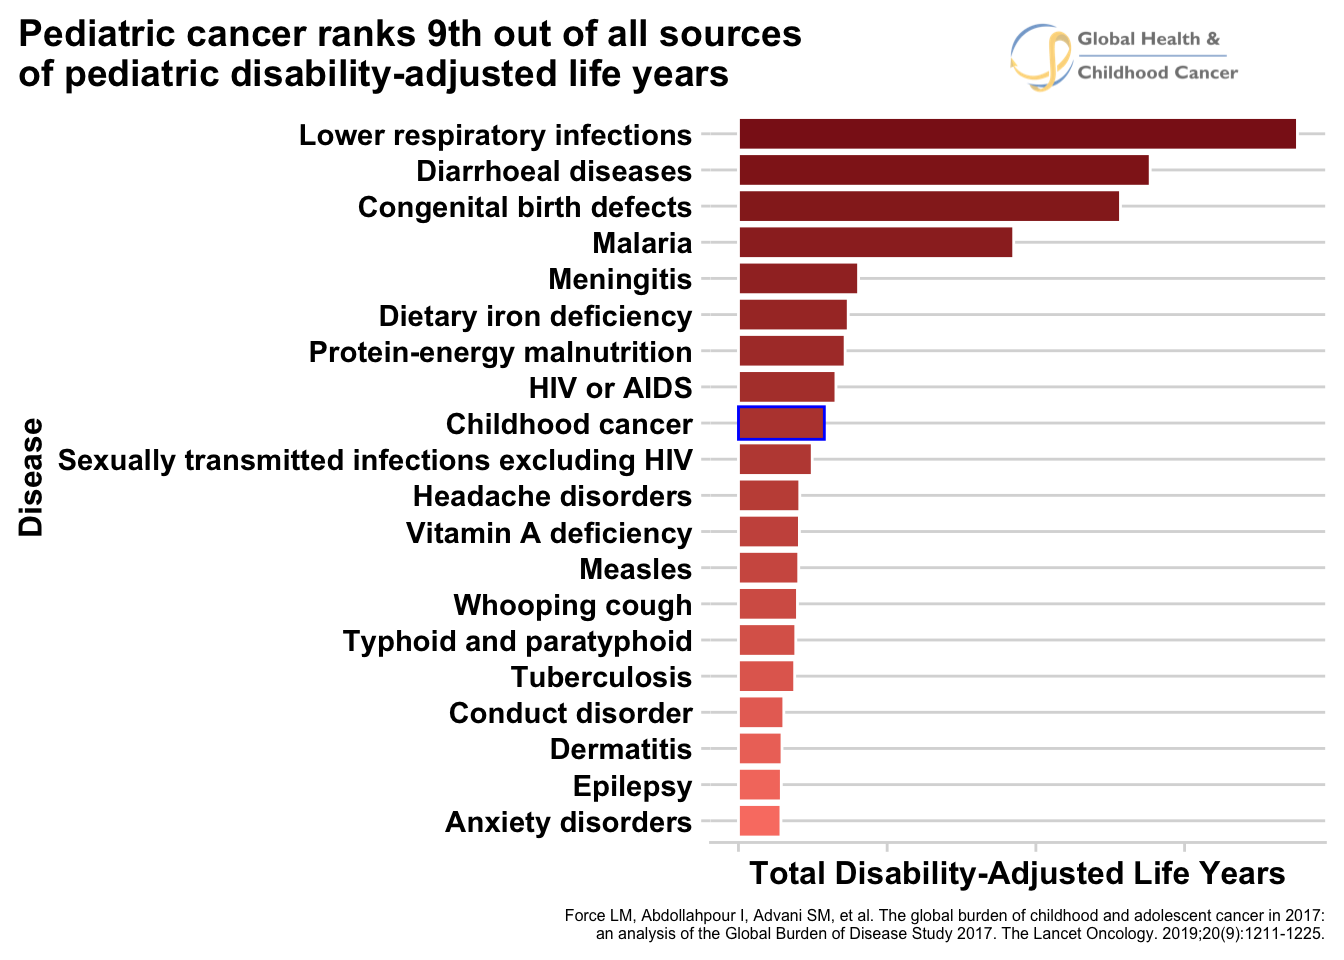
Fig. 8 - DALYs due to cancers
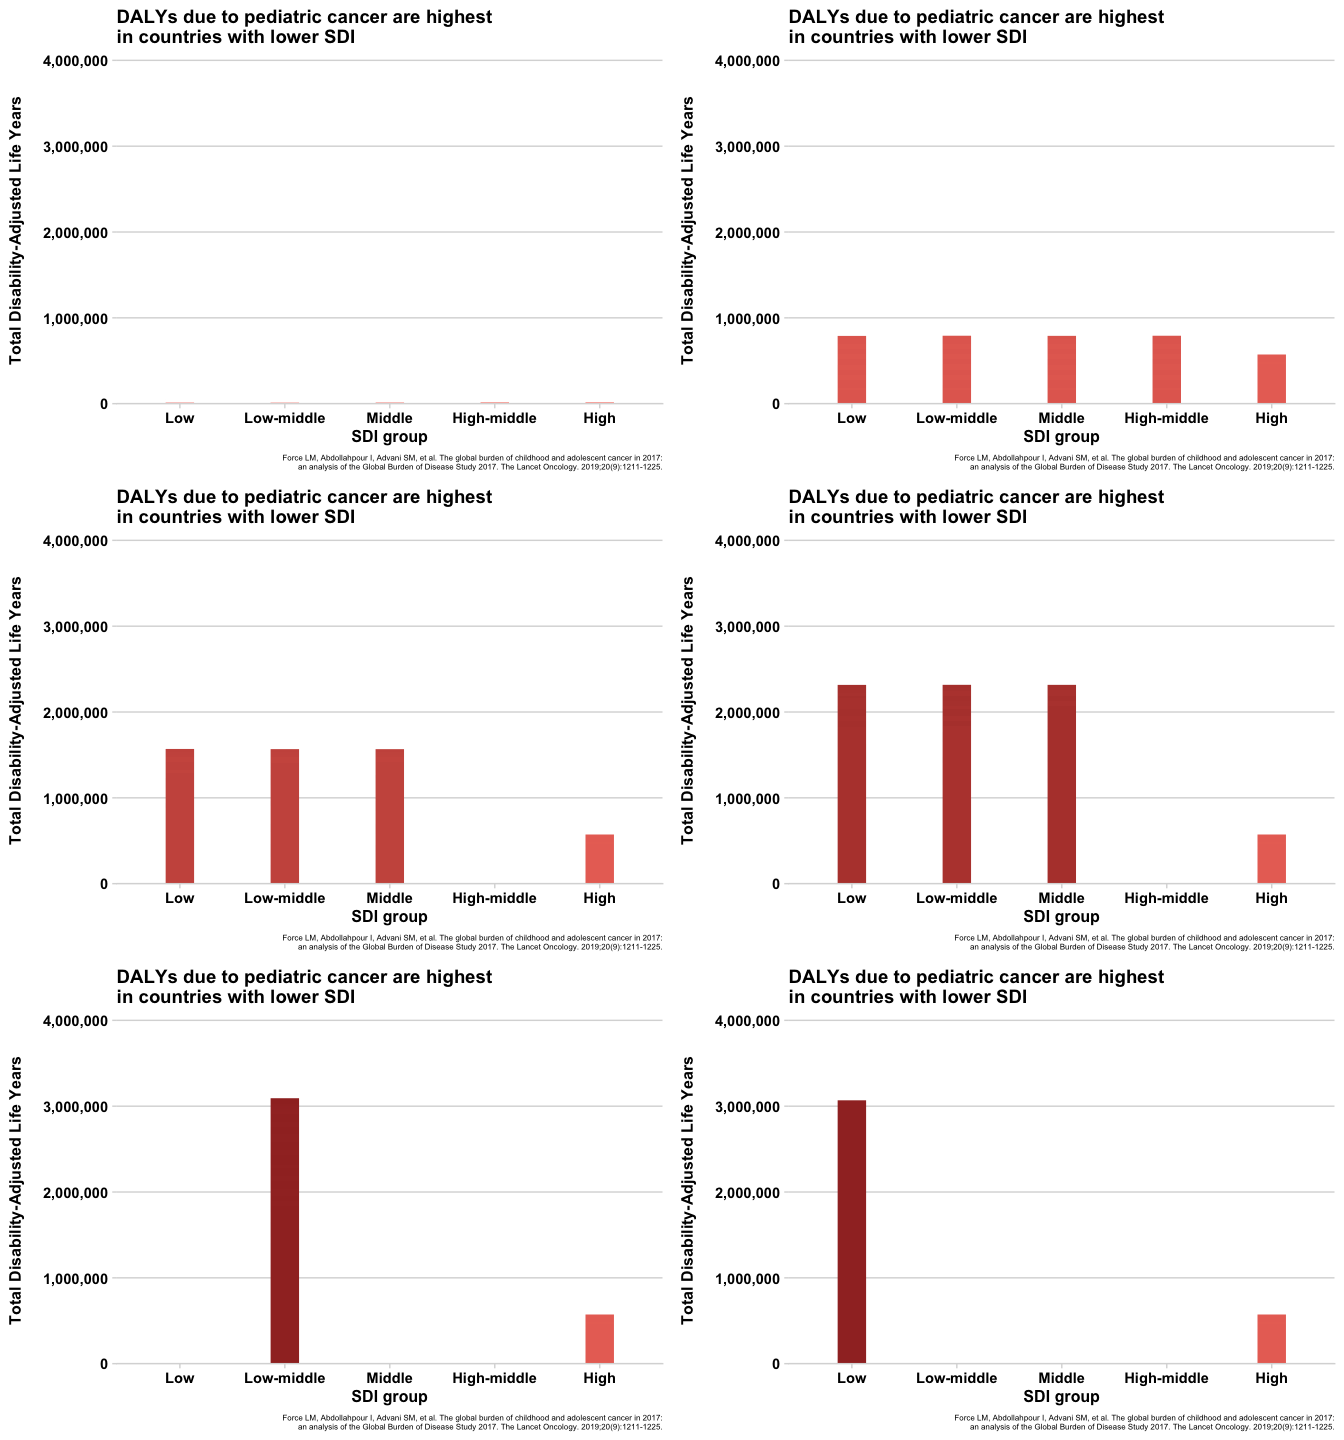
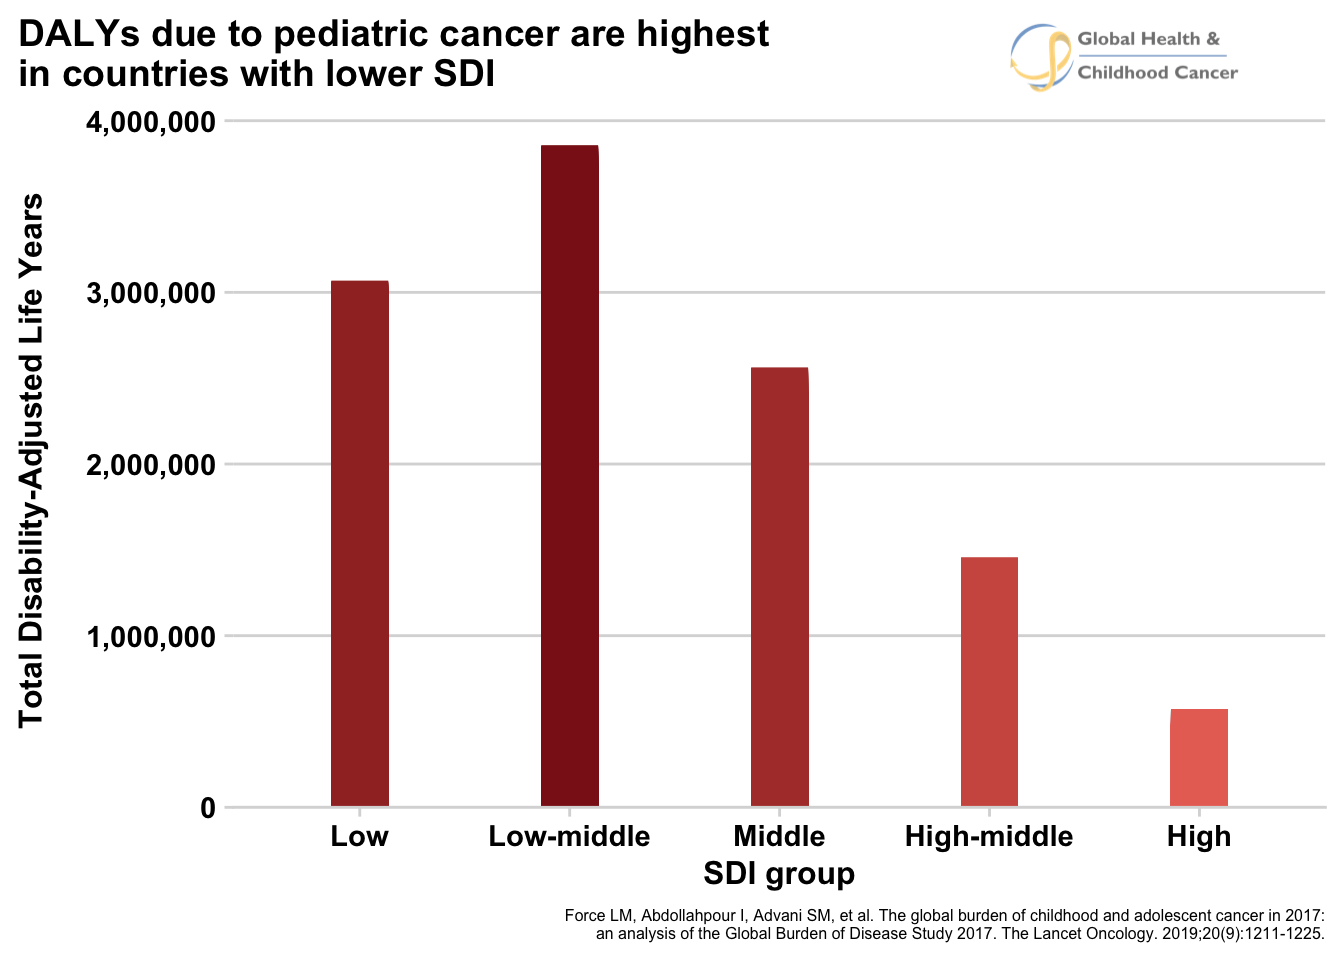
They also looked at groups of countries in the world are most responsible for the greatest number of DALYs. The researches grouped countries by their “sustainable development index” (SDI), a number that gives a rough assessment of a country’s level of development. Consistent with the findings we’ve discussed so far, they found that lower SDI countries are responsible for the large majority of DALYs. Figure 9 shows total number of DALYs by SDI grou. In this figure, we again see the trend that the regions in the world that are least prosperous are the ones that suffer the highest burden of disease.
Fig. 9 - Animated
Click for static image
Looking at GPO through the lens of DALYs not only helps us better understand the magnitude of the disease, but also informs discussion about how to set health priorities. The sad reality is that we live in a world of limited time, money, and resources. Because of these limitations, health officials, politicians, and other people who set healthcare policies in a country, have to make hard decisions about where to focus their efforts and resources. If decision makers do not have comprehensive information about the burden of diseases in their country, then they will not be able to make the best decision that will benefit the most people. As we have seen, comparisons of DALYs across diseases are a necessary measure to inform compassionate decisions.
A good example of this situation would be a health planner in an upper-middle income country that may need to decide whether to buy more cancer medicines or tuberculosis medicines for pediatric patients. According to the DALY estimates, for the average upper-middle income country pediatric cancer is the 3rd largest source of DALYs and tuberculosis is the 59th. This seems like an important piece of information for the health planner to know when making the decision. I’m certainly not saying that this is the only component to the decision. She would also need to consider costs, implementation feasibility, social context and a host of other factors that are not mentioned here. But I am saying that making the best decision that does the greatest amount of good is extremely difficult and can only be done when comprehensive information about the burden of the disease is available.
We spent time developing an intuition for what DALYs are because they are so important for understanding this edge of the GPO puzzle. Although more rare than other disease of childhood, it is responsible for enormous suffering due to how lethal it is for young patients and how debilitating it can be for those who survive. DALYs help to describe what should be the case - that in 2017 there should have been 11.5 million healthy life years lived that were not. Understanding what the world would look like if every child with cancer receives optimal care helps put the tragedy of GPO in a new perspective that better conveys the magnitude of the problem compared to only looking at the total number of new cases or deaths per year. Lastly, DALYs are helpful to understand because they play an important role in health policy and allow people who have to make really hard decisions to be well informed. Anyone interested in addressing GPO through advocacy and health policy need to be comfortable with these concepts so they can speak the same language as the decision makers they seek to impact.
Summary of Edge #1 – The global burden of childhood cancer
We’ve come a long way in this discussion. We saw that LMICs suffer the most from pediatric cancer, where 90% of children with cancer live. We established that GPO is much more common than was previously thought, with around 400,000 new cases of pediatric cancer per year. We also identified the ongoing catastrophe of non-diagnosis, which results in around 43% of kids with cancer, or 175,000 children, never even being diagnosed. If things do not change, in the next 15 years, 3 million children with cancer will never be diagnosed nor have a chance at cure - the equivalent of 10 school buses of children disappearing every day for 15 years. We also saw that the average 5-year survival around the world is about 37%, but ranges between 8% and 83% with the vast majority of low survival rates in LMICs. The picture only worsens when we add patients who are not diagnosed and the teenage AYA patients. Measuring DALYs due to cancer demonstrated that GPO sits among the top sources of ill health in the world, ranking number 9 globally for all pediatric diseases, number in 3 in middle-income countries, and number 6 globally when compared adult cancers. See table 1 for a summary of these numbers. Thanks to the hard work of the people in the GPO community, we now have a clear picture of the magnitude of the burden of childhood cancer. Fitting these pieces together has shown the world that the suffering due to GPO is enormous and needs to be addressed now.
| Statistic | Value |
|---|---|
| Total incident cases of childhood cancer per year | 400,000 |
| Percent of kids with cancer that live in low- and middle-income countries | 90% |
| Number of non-diagnosed cases of childhood cancer per year | 175,000 |
| Non-diagnosed cases as a percent of total childhod cancer cases | 43% |
| Number of children who will not be diagnosed with cancer between 2015-2030 | 3,000,000 |
| Global average 5-year survival for childhood cancer (not including undiagnosed) | 37% |
| Global rank of childhood cancer when compared to other sources of pediatric DALYs | 9th |
| Global Rank of childhood cance when compared to other sources of cancer-related DALYs | 6th |
This exploration of the burden of disease is the first edge in the childhood cancer puzzle. Now that we have an increasingly clear picture of how much cancer there is and the suffering it causes, the next question is what to do about it? It is natural to feel saddened and overwhelmed by these numbers, and it may seem as though the problem is too big to be fixed, but I have good news: for the last three decades, the GPO community has been demonstrating that we can improve care, and we now know the right intervention can significantly improve survival in a short period of time. Answers already exist, it’s just a matter of putting the puzzle pieces together. How to improve outcomes is the second edge to the puzzle and will be the topic of the next visual essay.
References
- Ward ZJ, Yeh JM, Bhakta N, Frazier AL, Atun R. Estimating the total incidence of global childhood cancer: a simulation-based analysis. The Lancet Oncology. 2019;20(4):483-493.
- Ward ZJ, Yeh JM, Bhakta N, Frazier AL, Girardi F, Atun R. Global childhood cancer survival estimates and priority-setting: a simulation-based analysis. The Lancet Oncology. 2019.
- Force LM, Abdollahpour I, Advani SM, et al. The global burden of childhood and adolescent cancer in 2017: an analysis of the Global Burden of Disease Study 2017. The Lancet Oncology. 2019;20(9):1211-1225.