
The Global Childhood Cancer Puzzle - Edge 1.2
This is part two of a three part essay about the global burden of childhood cancer. If you haven’t read from the beginning, you may want to start from part 1. You can find part 3 here.
The probability of surviving cancer
The researchers mentioned in the last post did not stop at estimating incident cases and non-diagnosed cases, they also estimated the chance a child has of surviving their cancer after being diagnosed.\(^2\) Using methods similar to how they estimated new cases, the researchers reported that 37% of all patients with cancer survive for 5 years after diagnosis (5 years from diagnosis is chosen as a convenient time point for measurement purposes, but there is nothing special about it). Again, we could say, with some rounding, that on average around the world only 4 in 10 kids survive their cancer.
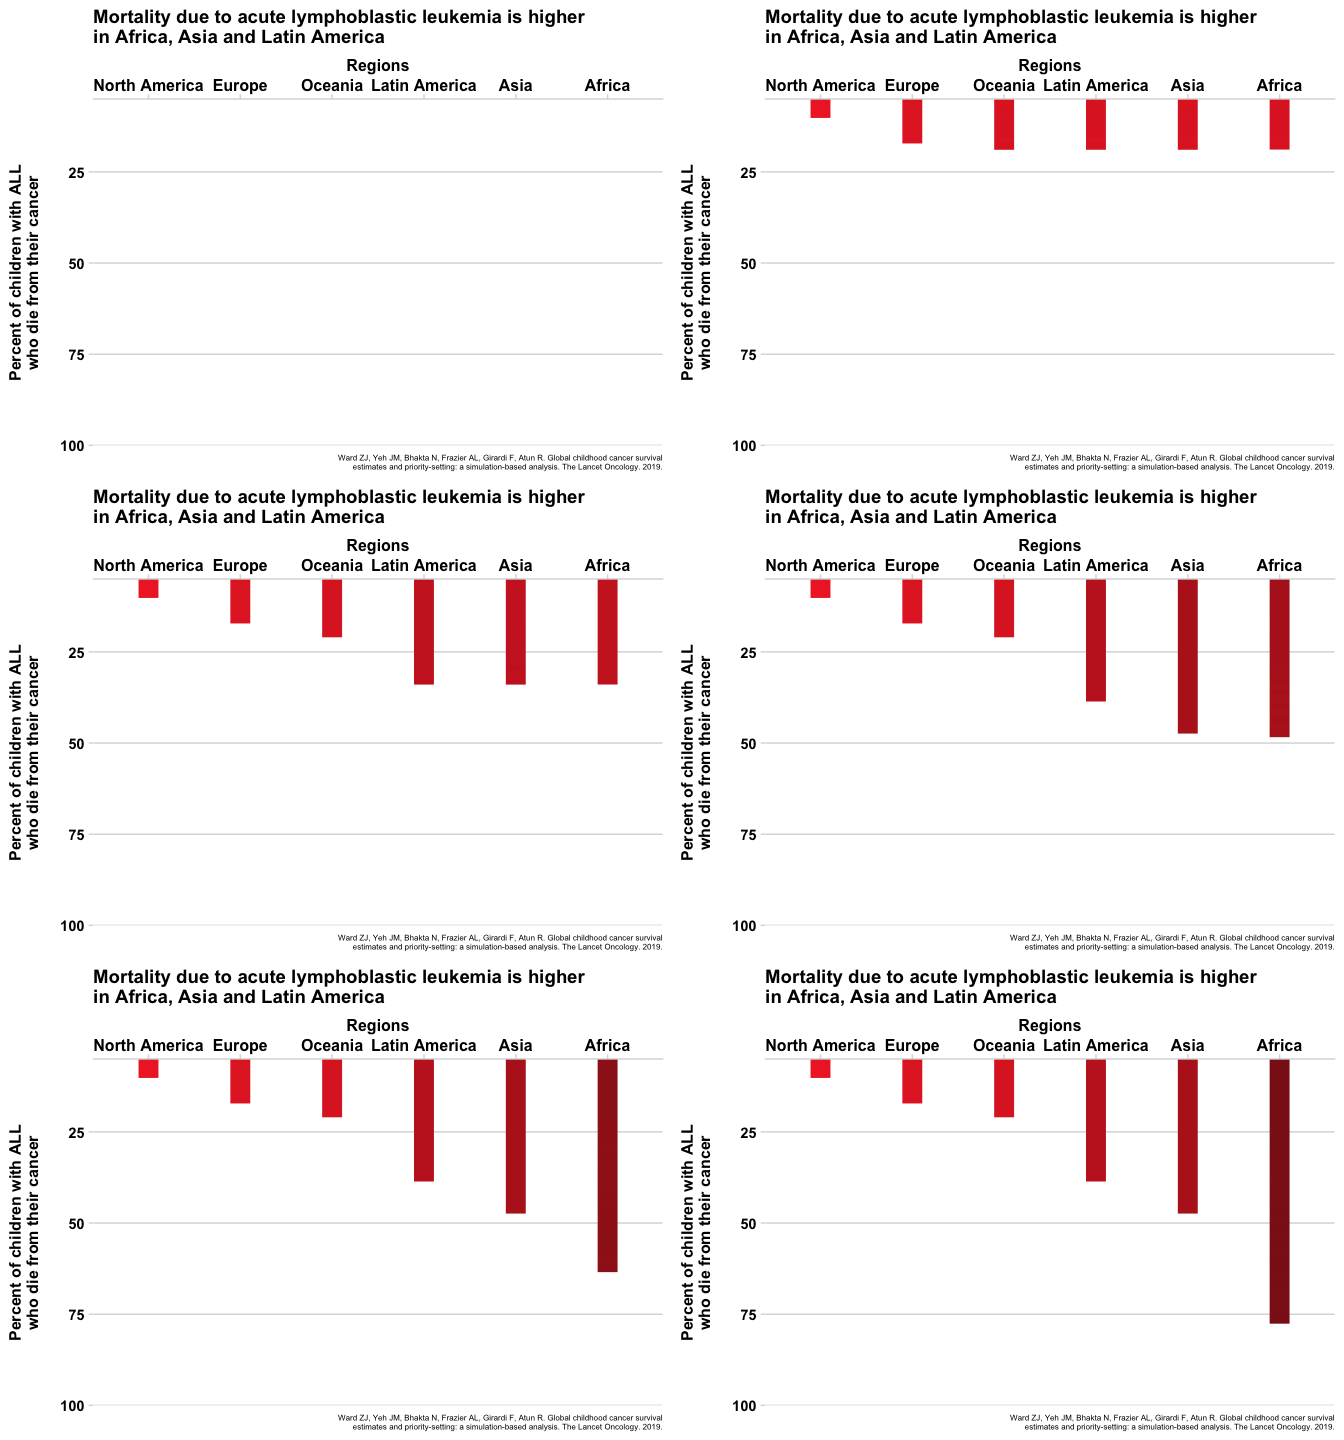
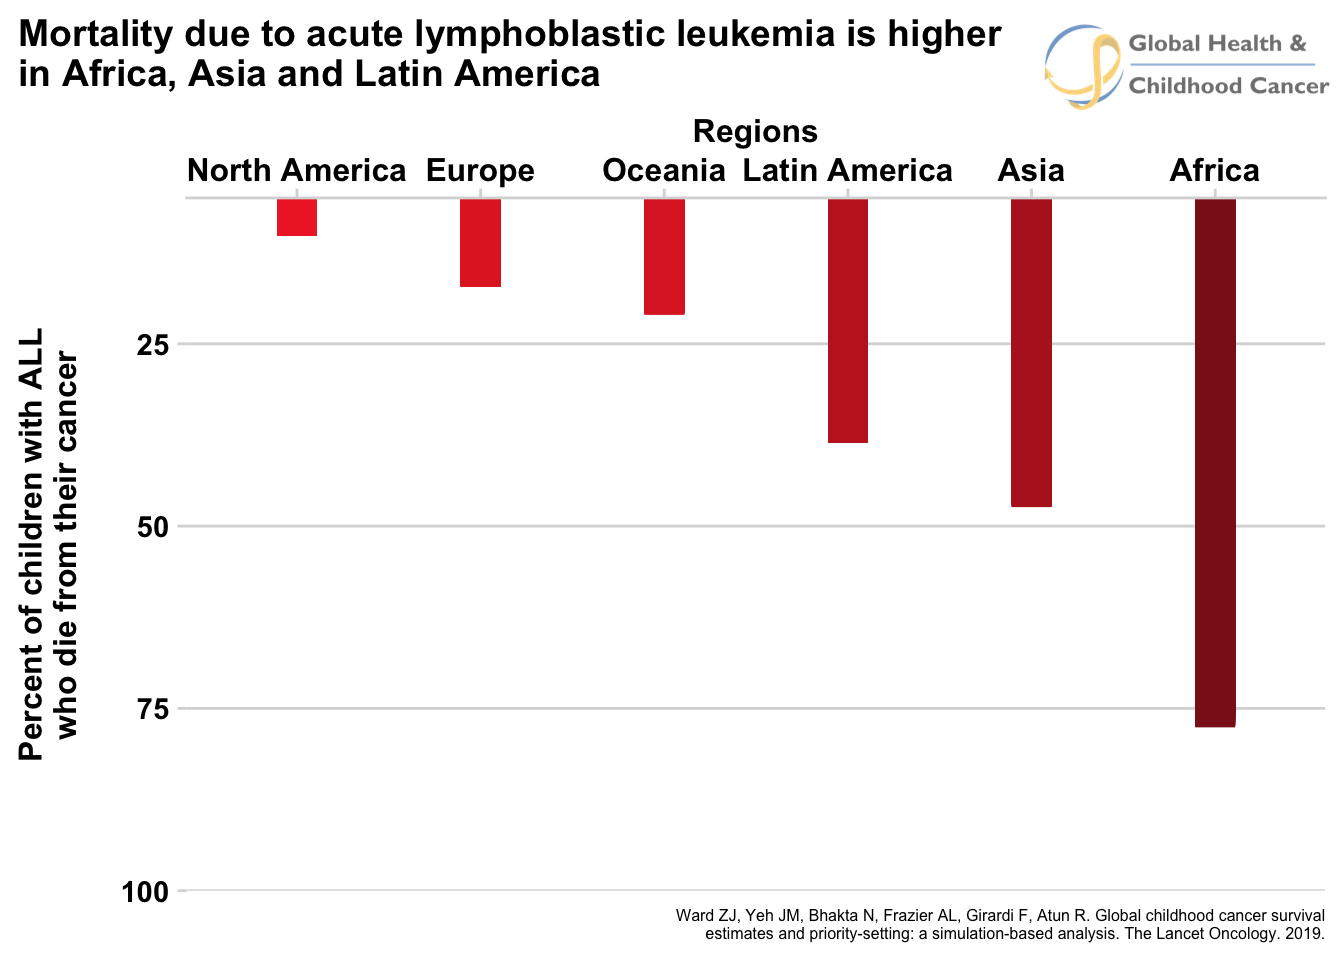
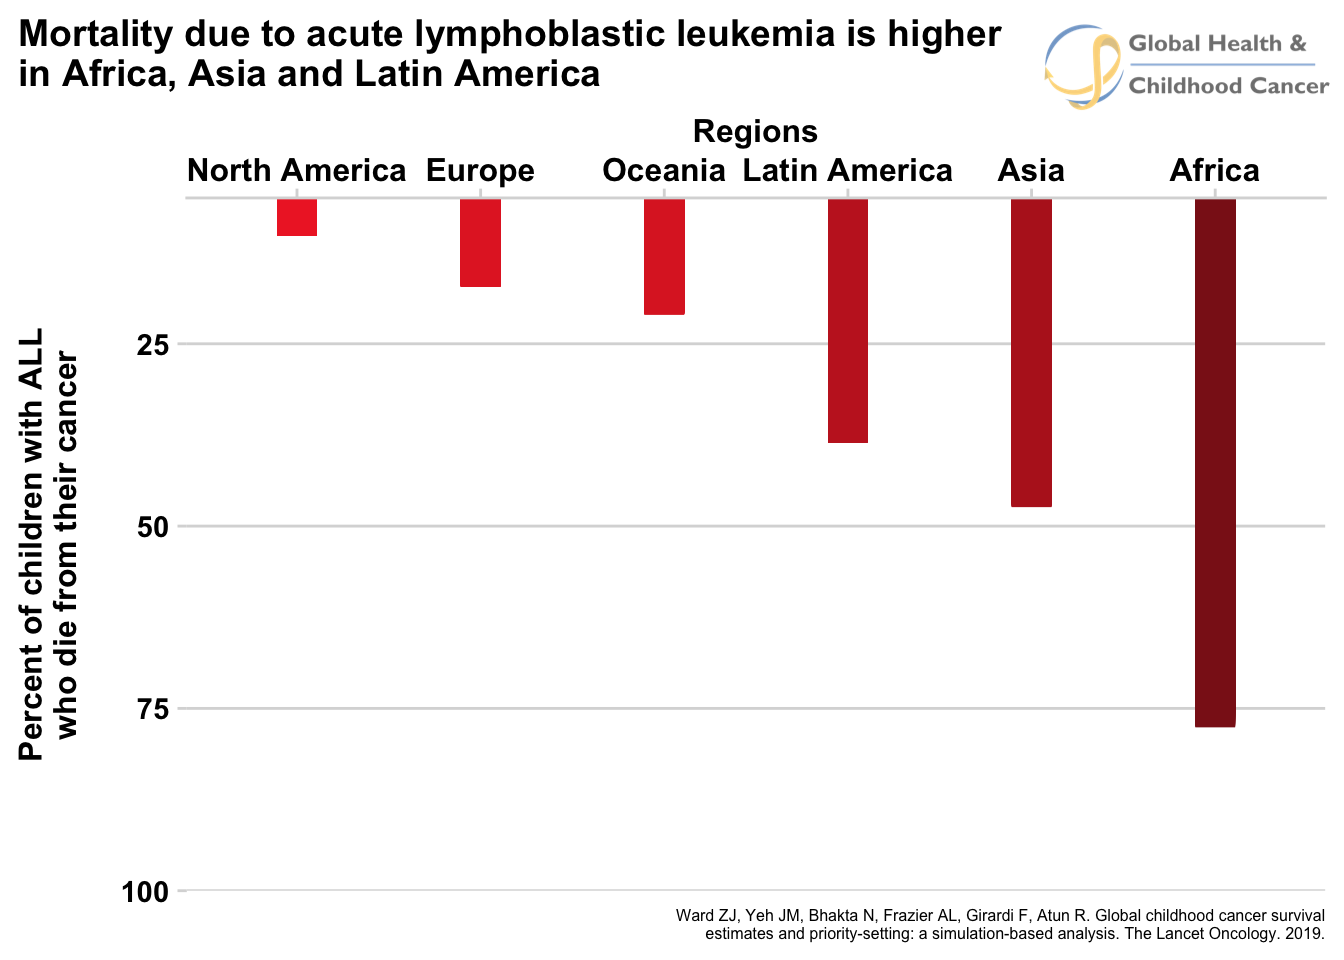
Like the incident cases, this estimate is actually very different in different parts of the world, except variability of the survival estimates is even larger than the incidence estimates. For instance, the 5-year survival percentage in a high-income country like North America is 83% (more than 8 in 10!), but in an economically-challenged region like eastern Africa, only 8% of all patients survive (roughly 1 in 10). Looking broadly across all countries, the trend that emerges from the data is that kids in LMIC have a much, much lower chance of surviving their disease. As an example, figure 4 shows the percent of mortality by region for acute lymphoblastic leukemia, a cancer of the blood.
Fig. 4 - Animated
Click for static image
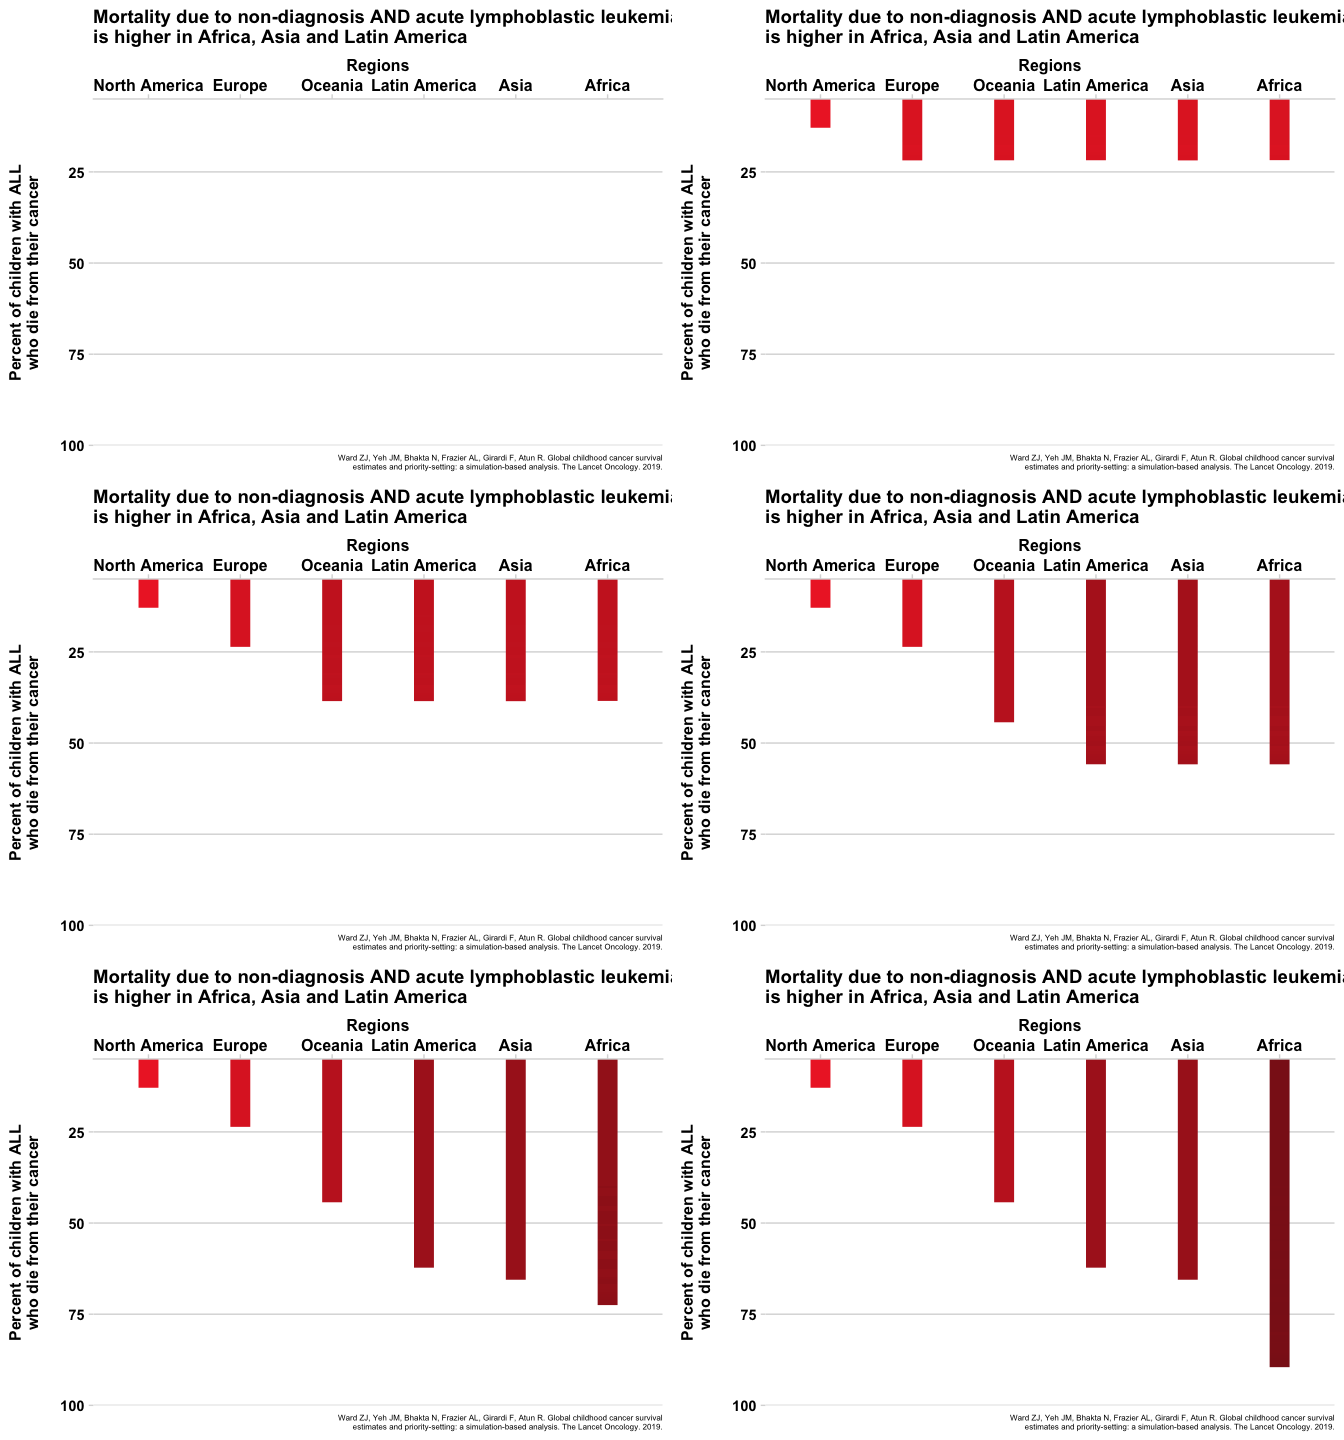
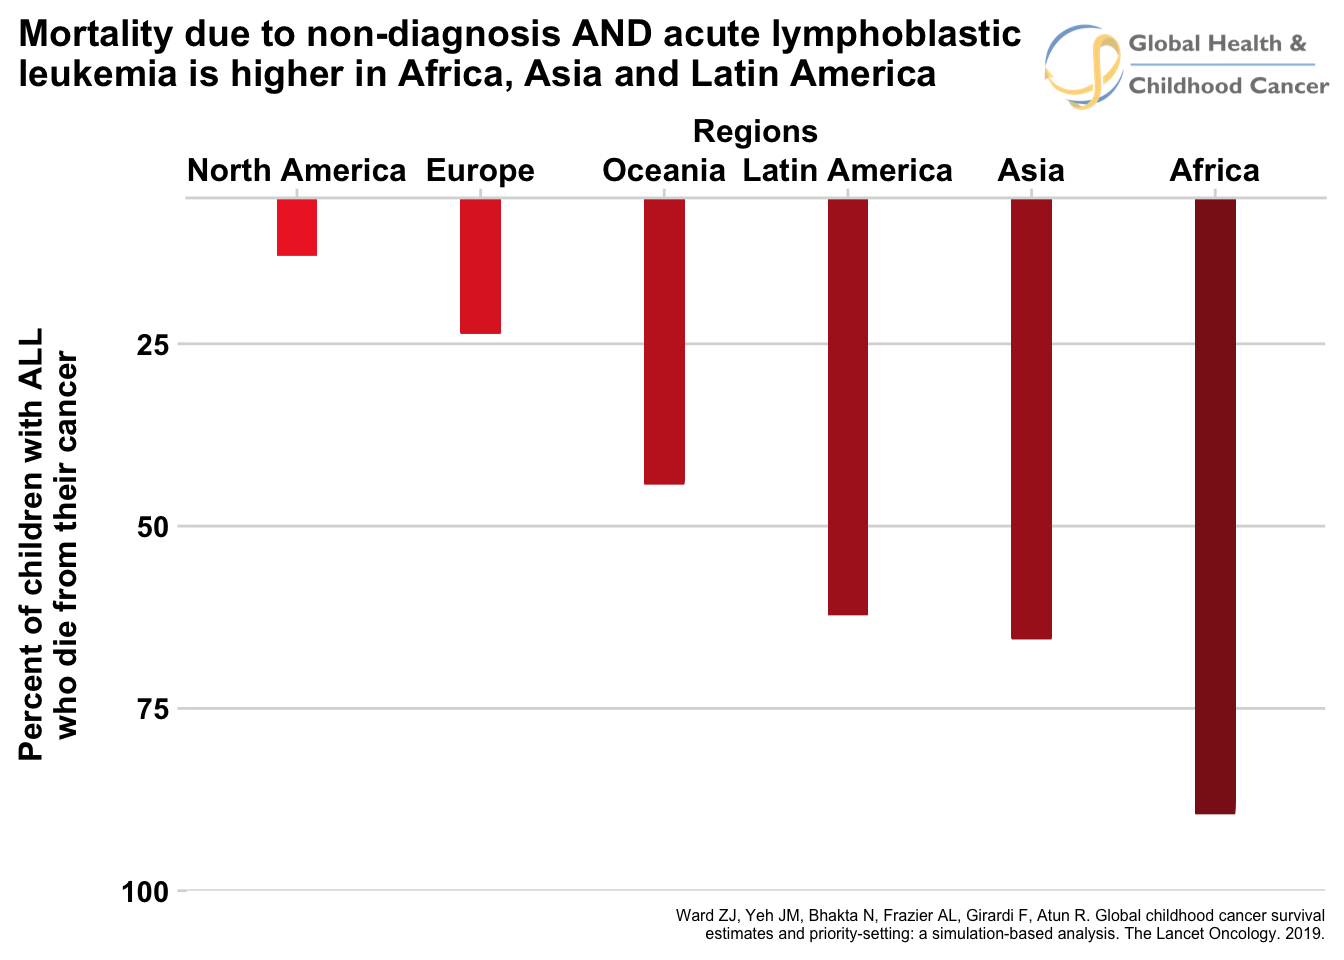
If these numbers were not depressing enough, there is a twist to the story. These survival estimates are only for patients who are diagnosed with cancer. Remember earlier where we said 4 in 10 patients, on average, are not even diagnosed, and that this proportion is worse in LMIC? The patients who were not diagnosed were not factored in to the survival estimates. To get the true survival, we would have to consider what happens to the patients who are not diagnosed and the patients who are diagnosed and treated. Let me give a very crude example of how we might combine these numbers. It is safe to assume that most patients who are not diagnosed will die from their disease, but to be conservative and factor in some uncertainty to the estimates, let us put the number for patients who are not diagnosed but survive at 10%. Suppose country A demonstrates a 5-year survival of 50% for disease X, but only 50% of kids who develop the disease are diagnosed. The total number who survive would be (0.5 x 0.5) + (0.1 x 0.5) = 0.30 or 30%. The specifics of the math aren’t too important, what is important is that factoring in non-diagnosis drops the survival rate by a large amount. Unfortunately, since patients in LMIC are both less likely to be diagnosed and less likely to survive, looking at the data in this way worsens the numbers of LMICs more than HICs. Figure 5 shows the new estimates when factoring non-diagnosis into the equation.
Fig. 5 - Animated
Click for static image
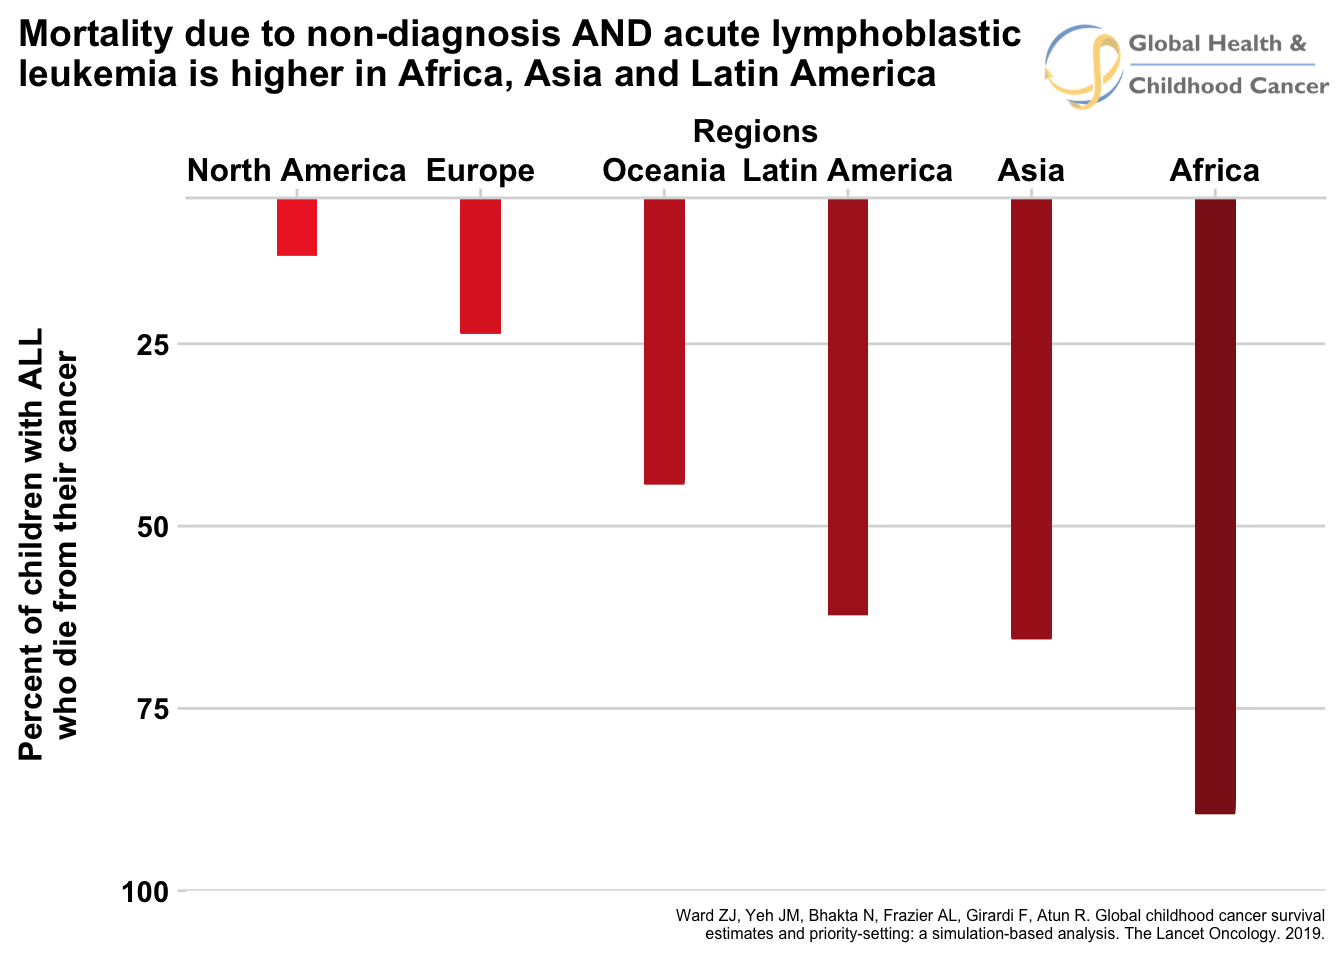
For comparison, here are the two static graphs side-by-side when non-diagnosis is not included (left) and when it is (right). You can see the number of who die does not increase much for North America and Europe when includiding non-diagnosis due to the simple fact that most patients are diagnosed. The numbers increase significantly for the rest of the regions, representing high rates of patients who are not diagnosed.
(Important technical note: It bears repeating that these calculations are very imprecise and there is unaccounted for uncertainty that makes them more difficult to combine than the above procedure suggests. I am using point estimates for the sake of clarity and ignoring the intervals of uncertainty associated with the estimates. These numbers are only for the purpose of illustrating the relationship between income category, non-diagnosis, and survival and should not be reported as precise estimates.)
If that wasn’t enough, there is actually a further twist to the story. The estimates for both incident cases and survival are for patients ages 0-14 years only. We should keep in mind that many 15-19 year-olds that develop cancers are considered to be “pediatric” patients that pediatric oncologists (at least in the United States, where I work) will treat. There is even a name for a unique category of patients that includes this age group called “Adolescent and Young Adults”. We won’t go into more detail of this age group because less reliable information is available (an example of problem number 2 in quantifying disease burden from earlier!), but it is important to know that these patients are not included in the above discussion, and the true number of pediatric patients is higher as a result.
As you can see, the GPO community has come a long way in quantifying incident cancer cases and 5-year survival, and the story the numbers tell is grim. However, there is another part of the story that needs to be told, that of measuring disease burden from the perspective of the suffering it causes and the years of life it steals from its victims.
Continue reading:
Part 3
Subscribe to my podcast about global PHO at GHCCpod.com